Introduction
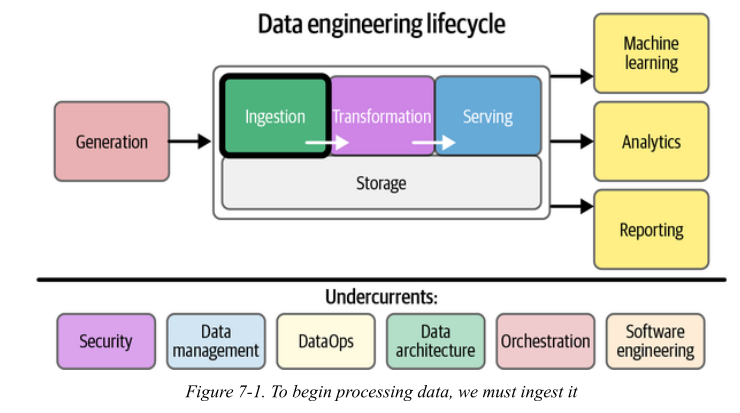
Image credit: Fundamentals of Data Engineering
Data ingestion implies data movement from source systems into storage in the data engineering lifecycle, with ingestion as an intermediate step.
Key considerations
1. What’s the use case for the data I’m ingesting?
The same data is ingested very differently depending on the use case.
Examples
1. Case A: Analytics dashboard
- Data: Orders
- Need: Daily revenue
- Approach:
- Batch ingestion (hourly/daily)
- ELT is fine
2. Case B: Fraud detection
- Data: Transactions
- Need: Detect fraud in seconds
- Approach:
- Streaming + CDC
- Low latency (< seconds)
2. Can I reuse data instead of ingesting duplicates?
Teams often create multiple pipelines for same data
Example:
Bad architecture ❌
DB → Pipeline A → Warehouse
DB → Pipeline B → Dashboard DB
DB → Pipeline C → ML system
- Same data ingested 3 times
- Inconsistent versions 😱
Good architecture ✅
NoteDB → CDC → Central Stream → Multiple consumers“Ingestion should happen once. Distribution happens downstream.”
Real-world failure
- Metrics mismatch between teams
- “Why is revenue different in dashboard vs ML model?”
3. Where is the data going? (Destination)
Why this matters:
Destination determines:
- Schema
- Format
- Latency
- Transformations
Examples:
| Destination | Ingestion Style | Notes |
|---|---|---|
| Data warehouse | Batch / ELT | Structured |
| Search engine | Stream | Needs indexing |
| ML feature store | Both | Needs freshness |
| Dashboard | Pre-aggregated | Fast queries |
Same data (orders):
- Warehouse → raw + SQL transforms
- Dashboard → aggregated table
- Kafka → event stream
Note
“Design ingestion backwards from the destination.”
4. How often should data be updated?
Tradeoff:
Freshness vs Cost
Examples:
Low frequency (batch)
- HR data → daily
- Reports → hourly
High frequency (streaming)
- Payments → real-time
- Notifications → instant
Note
“Not all data needs to be real-time.”
Anti-pattern
> “Let’s use Kafka for everything” ❌
5. What is the expected data volume?
Why this matters
Volume determines:
- Tooling (Kafka vs cron job)
- Storage cost
- Partitioning strategy
Examples:
Small scale
- 10K rows/day
- Use simple cron + SQL
Large scale
- 1M events/sec
- Need:
- Kafka
- Partitioning
- Distributed systems
Note
“Scale changes architecture—not just hardware.”
Failure case
- Pipeline works in testing
- Crashes in production due to volume spike
6. What format is the data in?
Why this matters:
Format affects:
- Speed
- Compatibility
- Schema evolution
Examples
JSON
{ "user": 1, "order": 42 }
- Human-readable
- Large size
Protobuf / Avro
- Compact
- Faster
- Needs schema
Scenario
API ingestion
- JSON → easy
High-throughput streaming
- Protobuf → efficient
Note
“Format is a contract between producers and consumers.”
Failure
- Schema mismatch → pipeline breaks
7. Is data clean? What are data quality risks?
Reality
Raw data is always messy
Examples
Example: 1: Bot traffic
- Website logs inflated
- Fake clicks
Example: 2: Missing values
user_id = NULL
Example: 3: Duplicates
- Same event ingested twice
Solutions
- Deduplication
- Validation rules
- Filtering bots
Note
“Garbage in → garbage everywhere.”
Real-world impact
- Wrong business decisions
- Misleading dashboards
8. Do we need in-flight processing? (Streaming case)
Meaning
Processing data while it is moving
Example:
Example: 1: Fraud detection
Transaction → check rules → flag immediately
Example: 2: Notifications
Order placed → send notification instantly
Clicks → count per minute → dashboard
Without in-flight processing
Store → later process → too late ❌
Stream → process → act immediately ✅
“Streaming is about reacting, not storing.”
Scenario: Food Delivery App
| Question | Answer |
|---|---|
| Use case | Real-time tracking + analytics |
| Reuse | CDC → Kafka → multiple consumers |
| Destination | Warehouse + Notifications |
| Frequency | Real-time + hourly batch |
| Volume | High (orders, clicks) |
| Format | JSON → Protobuf later |
| Quality | Remove bots, deduplicate |
| In-flight | Yes (notifications, ETA updates) |
ETL vs. ELT
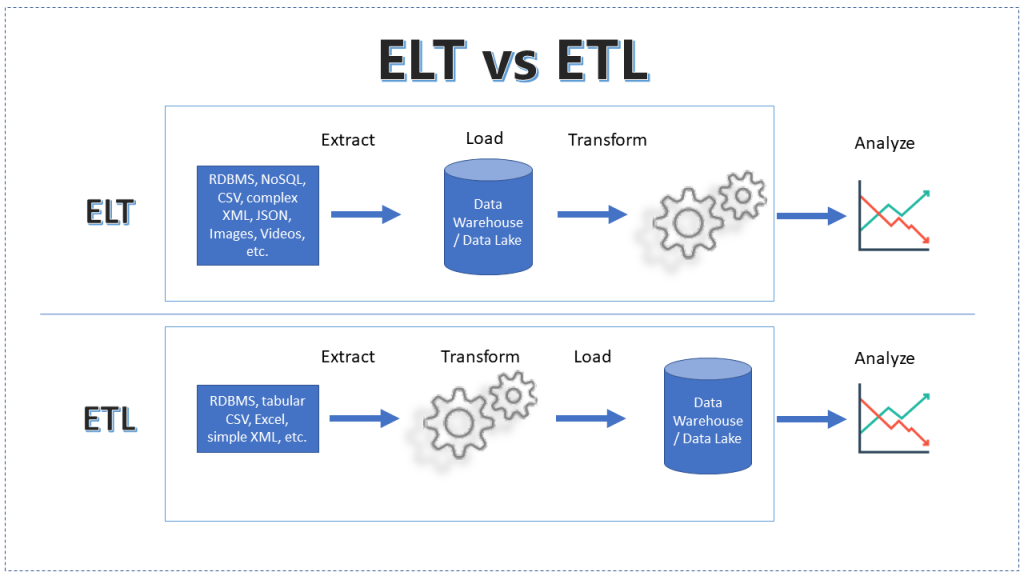
Image credit: ChatGPT
The Core Concept: The difference is not just the order of operations, but where the compute happens.
A. ETL (Extract, Transform, Load) - The Traditional Way
- Workflow: Data is extracted \rightarrow transformed in a separate staging server (using Spark, Informatica, etc.) \rightarrow loaded into the Data Warehouse.
- Why use it? When the target system is slow/expensive or when sensitive data (PII) must be masked before it lands.
- Downside: The transformation layer is a bottleneck. If the business requirements change, you have to re-ingest the raw data.
B. ELT (Extract, Load, Transform) - The Modern Way
- Workflow: Raw data is loaded directly into the Data Warehouse/Lake \rightarrow transformed using the target’s own compute (e.g., SQL in Snowflake or BigQuery).
- Why use it? Storage is cheap; Cloud Data Warehouse compute is massively parallel.
- The "dbt" Factor: Mention that ELT is the foundation of the "Analytics Engineer" role.
| Feature | ETL | ELT |
|---|---|---|
| Compute | External Engine | Target Warehouse |
| Flexibility | Rigid (Fixed Schema) | High (Schema-on-read) |
| Data Volume | Better for small/medium | Built for Big Data |
Change Data Capture: The "Delta" Strategy
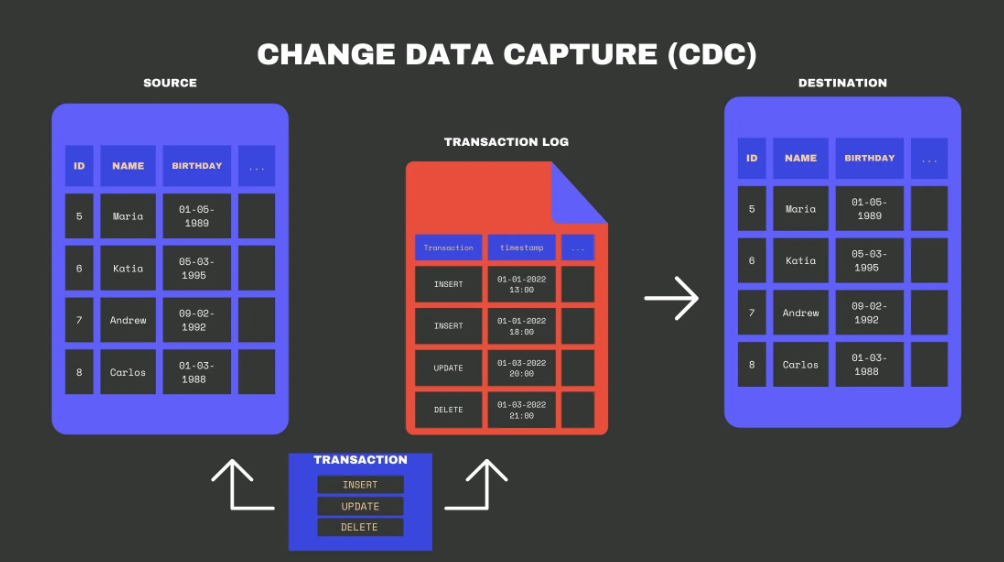
Image credit: Change Data Capture (CDC): Definition, Methods, and Benefits
The Problem: We cannot do a "SELECT *" on a 10TB production database every hour. It would crash the DB and waste bandwidth.
A. How CDC Works
CDC identifies and captures insertions, updates, and deletions in source tables so that only the changes are moved.
B. Two Primary Approaches:
1. Query-based (Poll): Checking a last_updated timestamp column.
- Flaw: It misses hard deletes and adds load to the source DB.
2. Log-based (Push): Reading the Database Transaction Log (e.g., MySQL Binlog, Postgres WAL).
- Benefit: Zero impact on DB performance; captures every single intermediate state of a row.
C. The CDC-to-Warehouse Pipeline
- Tooling Example: Debezium is the industry standard for turning DB logs into event streams.
Bridge: From Tables to Events
The Shift: Moving from "State" to "History."
- The Table view (State): "User X lives in Gandhinagar." (This is what you see in a DB).
- The Event view (Log):
- User X created account.
- User X added address: Ahmedabad.
- User X updated address: Gandhinagar.
Key Conceptual Takeaway:
- A Table is a snapshot of the Log at a point in time.
- A Log is the source of truth.
- Introduction to Message Queues: If CDC turns a database into a stream of events, we need a "buffer" to hold those events before they are processed. This is where Kafka enters.
References
- Chapter 7 Fundamentals of Data Engineering
- Change Data Capture (CDC): Definition, Methods, and Benefits